Here's a peak at a couple of graphics produced for my former colleagues at the Baltimore Sun.
The first shows the Orioles 2014 regular season campaign in two charts — Runs Scores vs. Runs Against and Games Above .500.
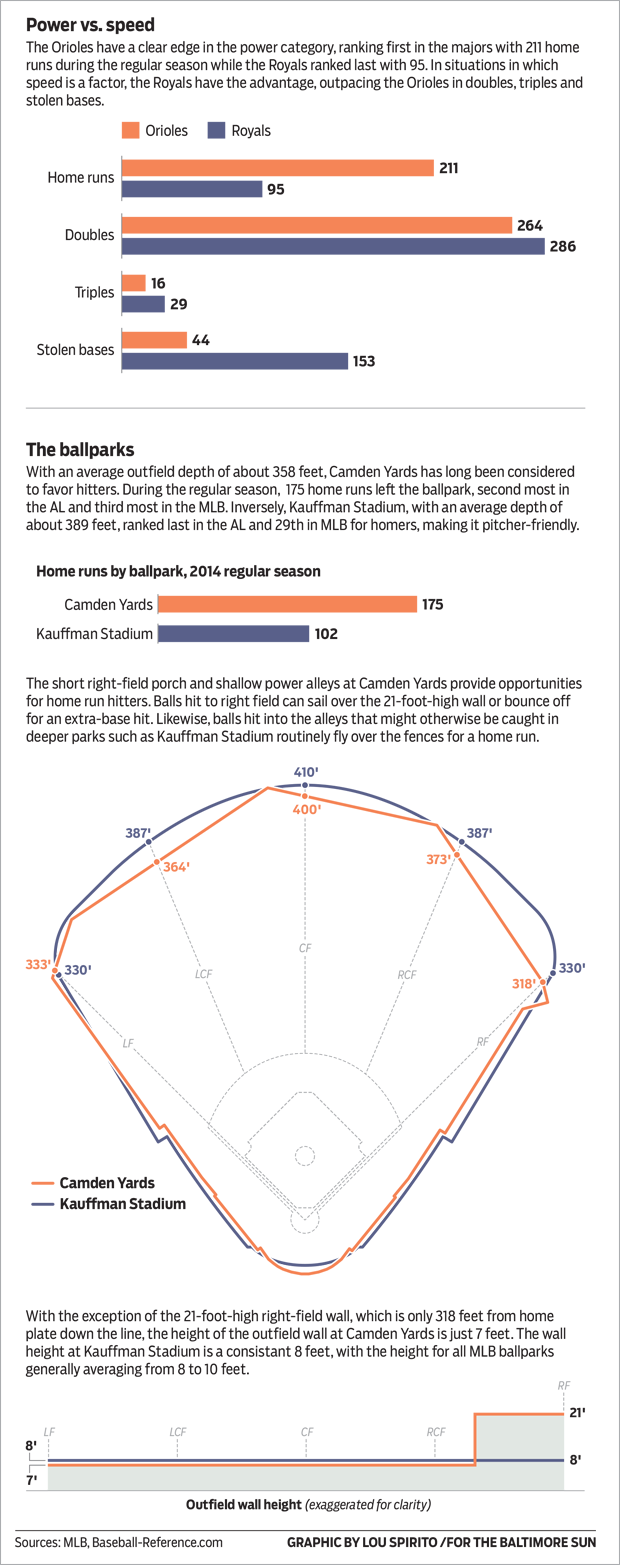
The second graphic was designed to accompany a story about the Orioles' power offense vs. the Royals' speed on the bases. It also features a comparison of Camden Yards and Kauffman Stadium using material culled from the ballparks posters.
Click on the images for full size PDF versions.